


Estimates of World Grain Production in 2013/2014
 By CnAgri2014-03-04 09:19:36
 Print
Print
According to BOABC’ monitoring, global grain price index continued declining significantly in Jan.. Significant decline of cereal price since August has restrained cereal production in the south hemisphere, especially corn.
In Dec., global grain price index was USD363/MT, up 0.41% MOM but down 11.39% YOY deducting value change of USD, increasing for 3 consecutive months, which would influence grain planting acreages in 2014.
Prices for different grain varieties:
In Dec., average prices for wheat, corn and rice were USD317/MT, USD268/MT and USD602/MT, up 0.14%, down 0.54% and down 5.30% respectively MOM and down 7.70%, 20.66% and up 1.39% respectively YOY. Continuous decline of wheat price may influence its planting. If spring wheat planting acreages decline in 2014, the price may see resilience. Seven consecutive months’ decline of corn price restrained corn production globally, which might stop corn price from further declining. If spring corn planting declines significantly in the north hemisphere, global price will rebound. International price increased due to production decline of indica rice in the south of China and large amounts of imports.
Grain futures price index was USD225/MT in Dec., down 1.65% MOM and down 22.48% YOY, in which, CBOT wheat futures price was USD213/MT, down 6.25% MOM and down 23.52% YOY. Significant growth of Australian wheat production caused the decline of CBOT futures; corn futures price was USDD167/MT, up 0.36% MOM and down40.44% YOY, influenced by global production increase and demand decline.
As for fossil oil, in Jan. 2014, New York crude oil price was USD729/MT, up 2.14% MOM and 5.97% YOY. Price increase of crude oil shall raise grain production cost and drive grain consumption, lowering down stocks.
For price ratio between different grain varieties, in Jan., price ratio between wheat and grain was 0.87 and the increase shall suppress growth of wheat trade and consumption. Price ratio between corn and grain was 0.74 and that between rice and grain was 1.66.
In addition, barley price was USD236/MT in Jan., down 18.24% YOY but up 0.89% MOM, indicating global production increase in 2013. Soybean price was USD747/MT, down 1.51% MOM and up 3.37% YOY. Soybean is the only agricultural product whose price sees increase, indicating tight soybean supply, which favors soybean production in the south America. Soybean production replaces corn in some areas.
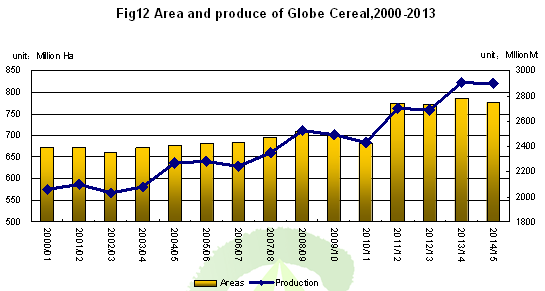
The harvested grain acreage and grain production are estimated to be 787 million hectares and 2.9086 billion MT in 2013, 2.02% and 8.07% more than last year respectively. Production increase is the key factor holding down price, especially high production in China, India and CIS countries.
But significant decline of cereal price shall decrease the planting in major exporters. BOABC estimates that global cereal planting acreage shall decline 1.32% to 778 million hectares in 2014. But the planting acreages in China and India shall keep increasing, which to some extent restrains global planting acreages from declining. Based on unit yield change in recent 5 years, cereal production is predicted to reach 2.9 billion MT, historically high. The high production shall restrain the price, so cereal prices shall see no great rebound in 2014.
For different varieties, wheat acreage and production are about 226 million hectares and 712 million MT in 2013/14, down 1.04% but up 8.16% respectively on the year-on-year basis. It is predicted global wheat planting acreage shall keep stable in 2014 and the production shall reach 720 million MT, an increase of 1.15% YOY. The price shall keep low in 2014/15, but will rebound in the second half year.
Corn acreage and production are 181 million hectares and 1.003 billion MT, up 2.42% and 12.07% respectively on the year-on-year basis. USA corn acreage and production increase lead to global increase. And the production increase continues weighing on corn price.
Global corn planting acreage is estimated to decline 5.04% to 172 million hectares and the production is forecast at 0.994 billion MT. The decline is mainly caused by decrease of production and planting acreage in American countries. Corn price is predicted to recover in the second half year.
Paddy acreage and production are 160 million hectares and 725 million MT, down 0.05% but up 0.90% respectively on the year-on-year basis. Converting to rice, the production was 492 million MT. The growth rate is the lowest among three major grains. Production growth rate is lower than consumption growth rate in low-income countries. For paddy production mainly concentrates in Asian countries, whose supply is tight and government will make efforts to support paddy production. Paddy planting acreage is estimated to be 161 million hectares, production 760 million MT, equal to 417 million MT rice in 2014.
Year-end grain inventory and safety index are predicted to be 894 million MT and 34.9% respectively in the world in 2013/2014. Annual price index is predicted to decline to 227. And year-end grain inventory and safety index are predicted to be 908 million MT and 34.3% respectively in the world in 2014/2015. Annual price index is predicted to decline to 241.
Specifically, wheat, corn and rice inventories are predicted to be 226 million MT, 306million MT and 164 million MT respectively in 2013/14, suggesting a safety index of 32.3%, 32.3% and 32.9% respectively and price index of 219, 184 and 327 respectively. And in 2014/15, wheat, corn and rice inventories are predicted to be 223 million MT, 282million MT and 183 million MT respectively in 2013/14, suggesting a safety index of 30.8%, 27.7% and 36.8% respectively with price index of 226, 193 and 353 respectively.

From “China Grains Market Weekly Report”
Recommended Reports »
- China’s Fertilizer Market Review & Outlook Outline (2013/2014)
- China Fruit (Vegetable) Juice & Beverage Market Review & Outlook 2013/2014
- Review and Outlook of China’s Dairy Industry 2013/2014
- China Feed Market Review & Outlook 2013-2014
- China Feed Additives Market Review & Outlook 2013-2014
- China Livestock Market Review & Outlook 2013 /2014
- Report on Operation and Investment Strategy of China’s Fresh Food E-commerce Industry
- China’s Rice Processing Industry Competition and Development Countermeasures
- Report on Application of D40, D70 & D90 in the Market of Formula Milk Powder
- Depth Analysis of China Broiler Chicken Market Status in 2013

Most Popular »
- Average Price of Yellow Phosphorus in China
- Spot Price of Shelled Peanuts and Peanut Oil
- Government to Subsidize Poultry Industry
- China's Dairy Products Impo...
- Senate Proposes Higher 'Junk Food' Tax
- Coca-Cola Promoted New Orga...
- Asian Largest Sugar Refiner...
- Palm Oil Imports in 2012
- China Soymeal Price Down w...
- Glyphosate market muted with price upward
- Fishmeal Price to Rise with Low Level of Stocks
- Fertilizer Export in Dec. 2013
- Wheaten Food & Rice Food Production in Nov. 2013