


China's PMI Decreased in June
 By CnAgri2012-07-10 18:54:23
 Print
Print
Department of Service Statistics of NBS
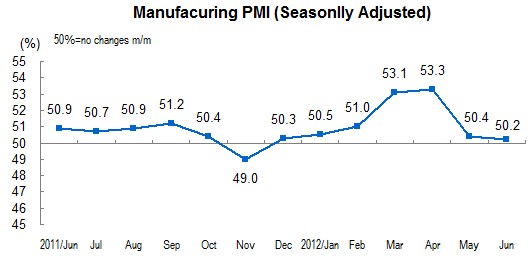
In June,
In view of the sizes of enterprises, the PMI of large-sized enterprises was 50.6 percent, decreased 0.5 percentage points, month-on-month, continuing stay above the threshold, that of medium-sized enterprises was 50.0 percent, staying above the threshold, that of small-sized enterprises was 47.2 percent, continuing to stay below the threshold for 3 consecutive months.
In June, among the five sub-indices composing PMI, two sub-indices increased, while of the other three sub-indices decreased.
Production index was 52.0 percent, decreased 0.9 percentage points month-on-month, which indicating that manufacturing production growth continued to slow down. In view of different industries, the production indices of textile wearing apparel manufacturing, electrical machinery and equipment manufacturing, railways, ship, aerospace and other transportation equipment manufacturing, foods, liquor, beverages and fine tea manufacturing, tobacco manufacturing positioned in a high place which above 60 percent, the production outputs increased dramatically month-on-month, the production indices of processing and coking of petroleum, chemical fiber manufacturing, rubber and plastic manufacturing, automobile manufacturing, special equipment manufacturing, textile manufacturing, and non-metallic mineral products manufacturing positioned below the threshold, the production of enterprises decreased in various degrees, month-on-month.
In June, the new orders index was 49.2 percent, fell by 0.6 percentage points month-on-month, continuing stay below the threshold for 2 consecutive months, which indicated that the market demand continued to decrease. In view of different industries, the new orders indices of foods, liquor, beverages and fine tea manufacturing, fabricated metal products manufacturing, tobacco manufacturing, electrical machinery and equipment manufacturing, and textile wearing apparel manufacturing kept stable increasing. The sluggish market demands of textile manufacturing, processing and coking of petroleum, chemical materials and chemical products manufacturing, automobile manufacturing, chemical fiber manufacturing, rubber and plastic manufacturing demand showed a significant reduction in business orders. In addition, the survey results showed that foreign new orders index which reflects the situation of foreign trade of manufacturing was 47.5 percent, positioned below the threshold, and down 2.9 percentage points month-on-month, which was the biggest drop since December 2011; the import index was 46.5 percent, decreased 1.6 percentage points month-on-month, continuing stay below the threshold for 2 consecutive months, which indicated that manufacturing orders from foreign products and raw materials imports have been reduced, month-on-month.
Main raw materials inventory index was 48.2 percent, up by 3.1 percentage points month-on-month, still staying below the threshold, which indicated that manufacturing inventories of raw materials continued to decline. In view of different industries, the main raw materials inventory indices of processing and coking of petroleum, railways, ship, aerospace and other transportation equipment manufacturing, and tobacco manufacturing increased significantly, jumped above 50 percent from below the threshold with a sharp increase in raw material inventory; that of textile manufacturing, automobile manufacturing, special equipment manufacturing, smelting and processing of non-ferrous metal ores, processing of timber, and furniture manufacturing were consecutive located below the threshold.
Employed person index was 49.7 percent, decreased 0.8 percentage points month-on-month, fell below the threshold, which indicated that the demand growth of manufacturing employment slightly slowed down, month-on-month. In view of different industries, employed person of railways, ship, aerospace and other transportation equipment manufacturing, chemical materials and chemical products manufacturing, non-metallic mineral products manufacturing, textile and apparel manufacturing, paper and printing industry, and cultural, educational, sporting goods manufacturing increased, that of automobile manufacturing, special equipment manufacturing, general equipment manufacturing, and textile manufacturing decreased month-on-month.
Supplier delivery time index was 49.1 percent, 0.1 percentage points higher month-on-month, still staying below the threshold.
In addition, the main raw material purchase price index was 41.2 percent, significant downturn in 3.6 percentage points month-on-month, positioned below the threshold for 2 consecutive months, which indicated that the manufacturing main raw material purchase price fell significantly. In view of different industries, the month-on-month prices of the main raw materials of the tobacco industry increased, the main raw material purchase price indices of agro-food processing industry, processing of timber, furniture manufacturing, was 50.0 percent, little change in corporate procurement costs over the previous month, the main raw material purchase price indices of other manufacturing industries fell in varying degrees over the previous month.
In addition, the produced finished goods inventory index rose to 52.3 percent month-on-month, 0.1 percentage points higher than the previous month, was s new high of in nearly seven months, which indicated that the pressure of finished goods inventory of manufacturing enterprises continuing to increase.
