


China's Non-manufacturing PMI Dropped in August
 By CnAgri2012-09-04 15:01:54
 Print
Print
Department of Service Statistics of NBS
China Federation of Logistics and Purchasing (CFLP)
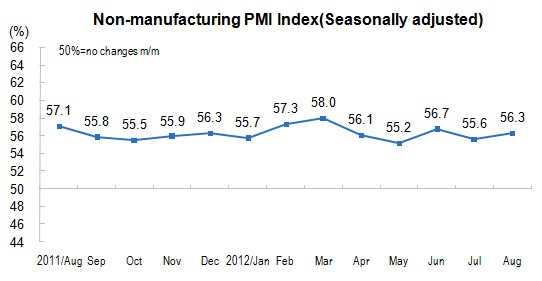
In August, non-manufacturing purchasing manager index was 56.3 percent, 0.7 percentage points higher than that in the previous month, still staying above the threshold.
In view of different industries, the purchasing manager index of construction was 61.1 percent, 0.7 percentage points higher than that in the previous month, still positioned in the high level of the range. The purchasing manager index of service was 55.1 percent, increased 0.7 percentage points month-on-month, of which, air transport, leasing and business services, accommodations, television and satellite transmission services industry positioned above the threshold, the total amount of the business maintained growth, railway transport, residents service and repair industry, and road transport positioned below the threshold, the total enterprise business decreased.
The new orders index declined slightly. The new orders index was 52.7 percent, a decrease of 0.5 percentage points compared with the previous month, indicating that the non-manufacturing market demands continued to maintain growth, but the growth has decelerated. In view of different industries, the new orders index of construction industry was 55.3 percent, dropped 1.7 percentage points over the previous month, which indicated that the growth rate of market demands of construction industry decelerated. The new orders index of service industry was 52.1 percent, 0.1 percentage points lower than that in the previous month. Of which, the new orders of air transport, internet and software information technology services, leasing and business services positioned above the threshold, which indicated that the market demand growth, that of road transport, water transport, railway transport, real estate positioned below the threshold, indicated that the market demand was decreased.
Intermediate input price index increased above the threshold. This index was 57.6 percent, up 7.9 percentage points than that in the previous month, which indicated that the growth rate of intermediate input price index of non-manufacturing enterprises increased. In view of different industries, the intermediate input price indices of construction industry was 50.9 percent, increased 4.7 percentage points month-on-month, positioned below the threshold, which indicated that construction production and operating costs went up. The intermediate input price indices of service industry was 59.3 percent, up by 8.8 percentage points month-on-month, the intermediate input price indices positioned above the threshold.
The subscription price index went above the threshold after below the threshold after 2 consecutive months, which reaching 51.2 percent, a month-on-month increase of 2.5 percentage points, which indicated that sales of non-manufacturing enterprises or charging prices rose month-on-month. In view of different industries, the subscription price index of construction industry was 49.5 percent, went up 1.9 percentage points. The subscription price index of service industry was 51.7 percent, increased 2.7 percentage points month-on-month, of which, leasing and business services, wholesale, air transport, retail sale positioned above the threshold, that of water transport, television and satellite transmission services industry, postal services positioned below the threshold.
Business activities expectation index dropped slightly, which stood at 63.2 percent this month, 0.7 percentage points lower month-on-month, still positioned in the high place of the range, which indicated that the non-manufacturing enterprises still continued to be optimistic. In view of different industries, the business activities expectation indices of postal services, retail sales, accommodations, house construction industry were all staying at a high level of 70 percent and above.
