


China's Manufacturing Purchasing Managers Index Decreased in July
 By CnAgri2012-08-01 17:51:00
 Print
Print
Department of Service Statistics of NBS
China Federation of Logistics and Purchases (CFLP)
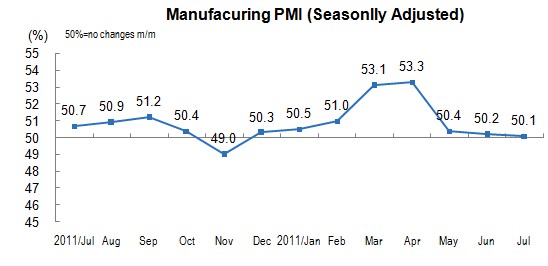
In July, China's manufacturing purchasing managers index (PMI) was 50.1 percent, down by 0.1 percentage points month-on-month, slightly higher than the threshold.
In view of the sizes of enterprises, the PMI of large-sized enterprises was 50.3 percent, decreased 0.3 percentage points month-on-month, that of medium-sized enterprises was 50.2 percent, increased 0.2 percentage points month-on-month, the above two indices were staying above the threshold; that of small-sized enterprises was 48.1 percent, increased 0.9 percentage points month-on-month, continuing to stay below the threshold for 4 consecutive months.
In July, among the five sub-indices composing PMI, one sub-index increased, while that of the other four sub-indices decreased.
Production index was 51.8 percent, decreased 0.2 percentage points month-on-month, which was the lowest point since December 2011, indicating that manufacturing production growth continued to slow down. In view of different industries, the production indices of agro-food processing industry, textile wearing apparel manufacturing, tobacco manufacturing, electrical machinery and equipment manufacturing, fabricated metal products manufacturing positioned above the threshold, the production outputs kept increasing month-on-month; the production indices of automobile manufacturing, special equipment manufacturing, textile manufacturing, chemical fiber manufacturing, rubber and plastic manufacturing, positioned below the threshold, the production of enterprises declined continuously.
In July, the new orders index was 49.0 percent, fell by 0.2 percentage points month-on-month, continuing stay below the threshold for 3 consecutive months, which indicating that the market demand continued to decrease. In view of different industries, the new orders indices of tobacco manufacturing, agro-food processing industry, textile wearing apparel manufacturing, electrical machinery and equipment manufacturing, computer communications and electronic equipment and instrumentation manufacturing stayed above the threshold, the volume of product orders of enterprises from customers increased in various degrees; the new orders indices of ferrous metal mining and processing, textile manufacturing, automobile manufacturing, special equipment manufacturing positioned below the threshold, the market demand declined. In addition, the survey results showed that foreign new orders index which reflects the situation of foreign trade of manufacturing was 46.6 percent, down 0.9 percentage points month-on-month, continuously positioned below the threshold for 2 consecutive months, and was the lowest point since December 2011; the import index was 45.0 percent, decreased 1.5 percentage points month-on-month, continuing stay below the threshold for 3 consecutive months, which indicated that manufacturing orders from foreign products and raw materials imports continued to reduce.
Main raw materials inventory index was 48.5 percent, up by 0.3 percentage points month-on-month, still staying below the threshold, which indicating that manufacturing inventories of raw materials continued to decline. In view of different industries, the main raw materials inventory indices of textile wearing apparel manufacturing and non-metallic mineral products manufacturing were above the threshold, with an increase in raw material inventory; that of fabricated metal products manufacturing, ferrous metal mining and processing, automobile manufacturing, general equipment manufacturing and special equipment manufacturing were below the threshold.
Employed person index was 49.5 percent, decreased 0.2 percentage points month-on-month, positioned below the threshold for 2 consecutive months, which indicating that the demand growth of manufacturing employment continued to reduce. In view of different industries, the employed person indices of railways, ship, aerospace and other transportation equipment manufacturing, agro-food processing industry, tobacco manufacturing were above the threshold, and demand for employed person increased; that of automobile manufacturing, textile manufacturing, fabricated metal products manufacturing, chemical fiber manufacturing, rubber and plastic manufacturing were below the threshold, and demand for employed person decreased.
Supplier delivery time index was 49.0 percent, 0.1 percentage points lower month-on-month, positioned below the threshold, which indicated that the delivery time of manufacturing suppliers of raw materials slowed down slightly.
The survey showed that the main raw material purchase price index was 41.0 percent, declined slightly 0.2 percentage points month-on-month, positioned below the threshold for 3 consecutive months, which indicating that the manufacturing main raw material purchase price continued to show a sign of decline. In view of different industries, the prices of the main raw materials of the agro-food processing industry, chemical fiber manufacturing, rubber and plastic manufacturing, tobacco manufacturing and textile wearing apparel manufacturing positioned above the threshold, that of other manufacturing industries were all below 50 percent, and the enterprises purchase prices fell in various degrees over the previous month.
In addition, the finished goods inventory index was 48.0 percent, down by 4.3 percentage points month-on-month, and positioned below the threshold, which indicating that the pressure of finished goods inventory of manufacturing has eased.
China's manufacturing PMI (Seasonally adjusted) | ||||||
Unit: % | ||||||
2012 | PMI | |||||
Production Index | New Orders Index | Main Raw Materials Inventory Index | Employed Person Index | Supplier Delivery Time Index | ||
January | 50.5 | 53.6 | 50.4 | 49.7 | 47.1 | 49.7 |
February | 51.0 | 53.8 | 51.0 | 48.8 | 49.5 | 50.3 |
March | 53.1 | 55.2 | 55.1 | 49.5 | 51.0 | 48.9 |
April | 53.3 | 57.2 | 54.5 | 48.5 | 51.0 | 49.6 |
May | 50.4 | 52.9 | 49.8 | 45.1 | 50.5 | 49.0 |
June | 50.2 | 52.0 | 49.2 | "+j+"、"+item.title+" "; }); string += jsonitem; } else { string += '没有找到相关的信息!'; } string += ""; $(obj).after(string); $('.key-float').mouseover( function (){ $(this).siblings().css({"z-index":0}) $(this).css({"z-index":1001}); } ) $(obj).next().css({ "left": +offset.left-100, "top": +offset.top+$(obj).height()+12}); }); } function add_favorite(title) { $.getJSON('http://www.cnagri.com/api.php?op=add_favorite&title='+encodeURIComponent(title)+'&url='+encodeURIComponent(location.href)+'&'+Math.random()+'&callback=?', function(data){ if(data.status==1) { $("#favorite").html('收藏成功'); } else { alert('请登录'); } }); } $(function(){ $('#Article .content img').LoadImage(true, 660, 660,'http://www.cnagri.com/statics/images/s_nopic.gif'); }) //--> | ||