China’s Feed Market Review & Outlook Report, 2012/2013
 By CnAgri 2012-12-11 11:39:16
 Print Tel:861064402118-822 Email: chen.wang@boabc.com
Price: (English Version) (Chinese Version)
Brief Introduction:
In “Review and Outlook on China Feed Market 2012/2013” compiled by BOABC, not only the market status quo of major feed raw materials & feed additives and imp & exp is analyzed deeply in details, but also the segment markets of hog feed, poultry feed, aquatic feed and ruminant feed as well as the top enterprises of each segment market are paid special attention, meanwhile prediction of feed industry’s development trend in 2013 in China will be discussed.
Table of Contents:
Contents
Part One Overview of China’s Feed Market, 2012/2013
1.2.2 “Measures for the Management of Production Licenses for Feeds and Feed Additives”
1.2.3 “Administrative Measures for Feed Additives and Feed Additives Premix Products Approval Number”
1.2.4 “Feed Production Enterprises Permission Conditions”
1.2.5 “Mixed Feed Addictives Production Enterprises Permission Conditions”
1.2.6 “Feedstuff Directory”
1.2.7 Interpretation of Other Policies Published in 2012
2.1.2 Product Types Constitution
2.1.3 Production Capacity Constitution of Complete feed Enterprises
2.2.2Analysis of China’s Feed Output 2012
2.2.3Analysis of the Feed Output of China’s Large-scale Feed Enterprises in 2012
Part Two Analysis of China’s Feed Market Segments, 2012/2013
Part Three Analysis of China’s Main Bulk Feed Ingredients Market, 2012/2013
Part Four Analysis of China’s Main Feed Addictives Market, 2012/2013
16.4.2 Consumption by Export
List of Part Tables and Figures
Table 1.1, Comparison of China’s Main Breeding Animals Inventory between 2011 and 2012
Figure 1.1, Global Industrial Feed Output and Forecast, 2007-2013
Figure 2.1, Structure of China’s Feed Enterprises in 2012 (by product types)
Figure 2.2, Number Variation of Complete feed Enterprises in China, 2007-2012
Figure 2.3, Output, Capacity and Capacity Utilization Rate of China’s Feed, 2007-2012
Figure 2.4, China’s Feed Output, 2007-2012
Figure 2.5, Output of China’s Scaled Feed Enterprises, 2007-2012
Figure 2.6, Retail Prices of China’s Complete feed for Fattening Pigs, Broiler and Layers, 2007-2012
Figure 2.7, Processing Profit of Feed for Hog, Broiler and Layers, 2007-2012
Figure 2.8, Variation of China’s Commercial Feed Market Capacity, 2007-2012
Figure 2.9, Weight of Top 10 Feed Enterprises’ Output in National Feed Output, 2007-2012
Figure 2.10, Top 10 Feed Enterprises and Their Market Share in 2012
Figure 3.1, Market Share of Hog Feed in China in 2012
Figure 3.2, Market Share Variation Trend of Hog Feed in China, 2007-2012
Figure 3.3, Variation Trend of China’s Hog Feed Output, 2007-2012
Figure 3.4, Variation Trend of China’s Hog Complete feed Output, 2007-2012
Figure 3.5, Variation Trend of China’s Hog Concentrated Feed Output, 2007-2012
Figure 3.6, Variation Trend of China’s Hog Premix Output, 2007-2012
Figure 3.7, Regional Structure of Hog Feed in China in 2012
Figure 3.8, Variation Trend of China’s Hog Feed Market Concentration, 2007-2012
Figure 3.9, Top 10 Hog Feed Enterprises and Their Market Share in 2012
Figure 4.1, Market Share Variation Trend of Meat Poultry Feed in China, 2007-2012
Figure 4.2, Variation Trend of China’s Meat Poultry Feed Output, 2007-2012
Figure 4.3, Variation Trend of China’s Meat Poultry Complete feed Output, 2007-2012
Figure 4.4, Variation Trend of China’s Meat Poultry Concentrated Feed Output, 2007-2012
Figure 4.5 Variation Trend of China’s Meat Poultry Premix Output, 2007-2012
Figure 4.6, Regional Structure of Meat Poultry Feed in China in 2012
Figure 4.7, Variation Trend of China’s Meat Poultry Feed Market Concentration, 2007-2012
Figure 4.8, Top 10 Meat Poultry Feed Enterprises and Their Market Share in 2012
Figure 5.1, Market Share Variation Trend of Egg-laying Poultry Feed in China, 2007-2012
Figure 5.2, Variation Trend of China’s Egg-laying Poultry Feed Output, 2007-2012
Figure 5.3, Variation Trend of China’s Egg-laying Poultry Complete feed Output, 2007-2012
Figure 5.4, Variation Trend of China’s Egg-laying Poultry Concentrated Feed Output, 2007-2012
Figure 5.5 Variation Trend of China’s Egg-laying Poultry Premix Output, 2007-2012
Figure 5.6, Regional Structure of Egg-laying Poultry Feed in China in 2012
Figure 5.7, Variation Trend of China’s Egg-laying Poultry Feed Market Concentration, 2007-2012
Figure 5.8, Top 10 Egg-laying Poultry Feed Enterprises and Their Market Share in 2012
Figure 6.1, Market Share Variation Trend of Aquiculture Feed in China, 2007-2012
Figure 6.2, Variation Trend of China’s Aquiculture Feed Output, 2007-2012
Figure 6.3, Variation Trend of China’s Aquiculture Complete feed Output, 2007-2012
Figure 6.4, Variation Trend of China’s Aquiculture Concentrated Feed Output, 2007-2012
Figure 6.5 Variation Trend of China’s Aquiculture Premix Output, 2007-2012
Figure 6.6, Regional Structure of Aquiculture Feed in China in 2012
Figure 6.7, Variation Trend of China’s Aquiculture Feed Market Concentration, 2007-2012
Figure 6.8, Top 10 Aquiculture Feed Enterprises and Their Market Share in 2012
Figure 7.1, Market Share Variation Trend of Ruminant Feed in China, 2007-2012
Figure 7.2, Variation Trend of China’s Ruminant Feed Output, 2007-2012
Figure 7.3, Variation Trend of China’s Ruminant Complete feed Output, 2007-2012
Figure 7.4, Variation Trend of China’s Ruminant Concentrated Feed Output, 2007-2012
Figure 7.5 Variation Trend of China’s Ruminant Premix Output, 2007-2012
Figure 7.6, Regional Structure of Ruminant Feed in China in 2012
Figure 7.7, Variation Trend of China’s Ruminant Feed Market Concentration, 2007-2012
Figure 7.8, Top 10 Ruminant Feed Enterprises and Their Market Share in 2012
Figure 8.1, Total Consumption of Main Bulk Feed Ingredients in China, 2009-2012
Figure 8.2, Total Consumption Structure of Main Bulk Feed Ingredients in China in 2012
Figure 8.3, Consumption of Main Bulk Feed Ingredients of Complete feed in China, 2009-2012
Figure 8.4, Consumption Structure of Main Bulk Feed Ingredients of Complete feed in China in 2012
Figure 8.5, Consumption of Main Bulk Feed Ingredients of Self-mixed Concentrated Feed in China, 2009-2012
Figure 8.6, Consumption Structure of Main Bulk Feed Ingredients of Self-mixed Concentrated Feed in China in 2012
Figure 8.7, Consumption of Main Bulk Feed Ingredients of Self-mixed Premix in China, 2009-2012
Figure 8.8, Consumption Structure of Main Bulk Feed Ingredients of Self-mixed Premix in China in 2012
Figure 8.9, Consumption Structure of Main Bulk Feed Ingredients of Hog Feed in China in 2012
Figure 8.10, Consumption Structure of Main Bulk Feed Ingredients of Meat Poultry Feed in China in 2012
Figure 8.11, Consumption Structure of Main Bulk Feed Ingredients of Egg-laying Poultry Feed in China in 2012
Figure 8.12, Consumption Structure of Main Bulk Feed Ingredients of Aquaculture Feed in China in 2012
Figure 9.1, Planting Area of Corn in China, 2007-2012
Figure 9.2, Corn Output in China, 2007-2012
Figure 9.3, Per Unit Area Yield of Corn in China, 2007-2012
Figure 9.4, Annual Average Price of Corn in China, 2007-2012
Figure 9.5, Changes of Corn Price in China in 2012
Figure 9.6, Import Volume and Export Volume of Corn in China, 2007-2012 (calendar year)
Figure 9.7, Import Volume and Export Volume of Corn in China, 2007-2012 (crop year)
Figure 9.8, Origins of China’s Imported Corn and Their Share in 2012
Figure 9.10, Corn Import Volume of Major Corn Importing Enterprises in China in 2012
Figure 9.11, Corn Export Volume of Major Corn Exporting Enterprises in China in 2012
Figure 9.12, Price and Export Volume of Corn in China 2007/2008-2012/2013
Figure 9.13, Corn Consumption Structure in China in 2012
Figure 9.14, Industrial Consumption Structure of Corn in China in 2012
Figure 9.15, Industrial Consumption and Price of Corn in China, 2007-2012
Figure 9.16, Corn Price and Feed Consumption in China, 2007-2012
Figure 9.17, Consumption of Corn in Complete feed and Self-mixed Feed in China, 2009-2012
Figure 9.18, Consumption of Corn in Various Animal Feed in China, 2009-2012
Figure 9.19, Wheat and By-product Consumption in Feed, 2009-2012
Figure 9.20, Changes of Corn Inventory in China, 2007/2008-2012/2013
Figure 10.1, Output of Domestic Soybean and Import Volume of Soybean in China, 2007-2012
Figure 10.2, Origins of China’s Imported Soybean and Their Share in 2012
Figure 10.3, Annual Average Price of Soybean Meal in China, 2007-2012
Figure10.4, Changes of Soybean Meal Price in China in 2012
Figure 10.5 Import & Export Volume of Soybean Meal in China, 2007-2012
Figure 10.6, Origins of China’s Imported Soybean Meal and Their Share in 2012
Figure 10.7, Destinations of China’s Exported Soybean Meal and Their Share in 2012
Figure 10.8, Soybean Meal Import Volume of Major Soybean Meal Importing Enterprises in China in 2012
Figure 10.9, Soybean Meal Export Volume of Major Soybean Meal Exporting Enterprises in China in 2012
Figure 10.10, Consumption of Soybean Meal in Feed in China, 2007-2012
Figure 10.11, Consumption of Soybean Meal in Complete feed and Self-mixed Feed in China, 2009-2012
Figure 10.12, Consumption of Soybean Meal in Various Animal Feed in China, 2009-2012
Figure 11.1, Global Fish Meal Output, 2007-2012
Figure 11.2, Regional Structure of Fish Meal Production in China in 2012
Figure 11.3, Output of Fish Meal in China, 2007-2012
Figure 11.4, Output and Import Volume of Fish Meal in China, 2007-2012
Figure 11.5, Origins of China’s Imported Fish Meal and Their Share in 2012
Figure 11.6, Destinations of China’s Exported Fish Meal and Their Share in 2012
Figure 11.7, Annual Price of Imported Fish Meal in China, 2007-2012
Figure 11.8, Monthly Price Trend of Imported Fish Meal in China, 2009-2012
Figure 11.9, Price Trend of Fish Meal in China in 2012
Figure 11.10, Fish Meal Import Volume of Major Fish Meal Importing Enterprises in China in 2012
Figure 11.11, Fish Meal Export Volume of Major Fish Meal Exporting Enterprises in China in 2012
Figure 11.12, Consumption and Price of Fish Meal in China, 2007-2012
Figure 11.13, Consumption of Fish Meal in Complete feed and Self-mixed Feed in China, 2009-2012
Figure 11.14, Consumption of Fish Meal in Various Animal Feed in China, 2009-2012
Figure 12.1 Output and Import Volume of Meat&Bone Meal in China, 2007-2012
Figure 12.2, Regional Structure of Meat&Bone Meal Production in China in 2012
Figure 12.3, Origins of China’s Imported Meat and Bone Meal and Their Share in 2012
Figure 12.4, Import Volume of Meat and Bone Meal of Major Meat and Bone Meal Importing Enterprises in China in 2012
Figure 12.5, Consumption of Meat and Bone Meal in China, 2009-2012
Figure 12.6, Consumption of Meat and Bone Meal in Complete feed and Self-mixed Feed in China, 2009-2012
Figure 12.7, Consumption of Meat and Bone Meal in Various Animal Feed in China, 2009-2012
Figure 13.1, Output of DDGS in China, 2007-2012
Figure 13.2, Price Trend of DDGS in China in 2012
Figure 13.3, Import&Export Volume of DDGS in China, 2007-2012
Figure 13.4, Origins of China’s Imported DDGS and Their Share in 2012
Figure 13.5, Destinations of China’s Exported DDGS and Their Share in 2012
Figure 13.6, Import Price and Export Price Trend of DDGS in China, 2009-2012
Figure 13.7, Consumption of DDGS in Various Animal Feed in China in 2012
Figure 13.8, Output of Rapeseed Meal in China, 2007-2012
Figure 13.9, Price Trend of Rapeseed Meal in China in 2012
Figure 13.10, Monthly Import&Export Volume of Rapeseed Meal in China, 2009-2012
Figure 13.11, Origins of Imported Rapeseed Meal in China and Their Share in 2012
Figure 13.12, Destinations of China’s Exported Rapeseed Meal and Their Share in 2012
Figure 13.13, Import Price and Export Price Trend of Rapeseed Meal in China, 2009-2012
Figure 13.14, Import Volume of Major Rapeseed Meal Importing Enterprises in China in 2012
Figure 13.15, Export Volume of Major Rapeseed Meal Exporting Enterprises in China in 2012
Figure 13.16, Consumption of Rapeseed Meal in Various Animal Feed in China in 2012
Figure 13.17, Output of Cottonseed Meal in China, 2007-2012
Figure 13.18, Price Trend of Cottonseed Meal in China in 2012
Figure 13.19, Import&Export Volume of Cottonseed Meal in China, 2007-2012
Figure 13.20, Origins of Imported Cottonseed Meal in China and Their Share in 2012
Figure 13.21, Destinations of China’s Exported Cottonseed Meal and Their Share in 2012
Figure 13.22, Import Price and Export Price Trend of Cottonseed Meal in China, 2009-2012
Figure 13.23, Consumption of Rapeseed Meal in Various Animal Feed in China in 2012
Figure 14.1, Output of Lysine in China, 2007-2012
Figure 14.2, Regional Structure of Lysine Production in China in 2012
Figure 14.3, Capacity Structure of China’s Lysine Manufacturing Enterprises in 2012
Figure 14.4, Output of 98.5% Lysine and 65% Lysine in China, 2007-2012
Figure 14.5, Import&Export Volume of Lysine in China, 2007-2012
Figure 14.6, Origins of Imported 65% Lysine in China and Their Share in 2012
Figure 14.7, Annual Price of Lysine in China, 2007-2012
Figure 14.8, Price Trend of 98.5% Lysine and 65% Lysine in China in 2012
Figure 14.9, Import Volume of Major 65% Lysine Importing Enterprises in China in 2012
Figure14.10, Consumption of 98.5% Lysine and 65% Lysine in China, 2007-2012
Figure 14.11, Domestic Consumption and Exportation of Lysine in China, 2007-2012
Figure 14.12, Exporting Countries of 65% Lysine in China and Their Share in 2012
Figure 14.13, Export Volume of Major 98.5% Lysine Exporting Enterprises in China in 2012
Figure 14.14, Export Volume of Major 65% Lysine Exporting Enterprises in China in 2012
Figure 15.1, Import Volume of Methionine in China, 2007-2012
Figure 15.2, Origins of Imported Methionine in China and Their Share in 2012
Figure 15.3, Annual Price of Methionine in China, 2007-2012
Figure 15.4, Import Volume of Major Methionine Importing Enterprises in China in 2012
Figure 15.5, Consumption of Methionine in China, 2007-2012
Figure 16.1, Regional Structure of Threonine Production in China in 2012
Figure 16.2, Enterprises Structure of Threonine Production in China in 2012
Figure 16.3, Output of Threonine in China, 2007-2012
Figure 16.4, Annual Price of Threonine in China, 2007-2012
Figure 16.5, Consumption of Threonine in China, 2008-2012
Figure 16.6, Import&Export Volume of Threonine and other Amino-acid in China, 2007-2012
Figure 17.1, Output of Vitamin A in China, 2009-2012
Figure 17.2, Monthly Price Changes of Vitamin A in China, 2010-2012
Figure 17.3, Import&Export Volume of Vitamin A in China, 2009-2012
Figure 17.4, Origins of Imported Vitamin A in China and Their Share in 2012
Figure 17.5, Destinations of China’s Exported Vitamin A and Their Share in 2012
Figure 17.6, Changes of Import&Export Price of Vitamin A in China, 2009-2012
Figure 17.7, Importing Enterprises of Vitamin A in China and Their Share in 2012
Figure 17.8, Exporting Enterprises of Vitamin A in China and Their Share in 2012
Figure 17.9, Output of Vitamin B2 in China, 2009-2012
Figure 17.10, Monthly Price Changes of Vitamin B2 in China, 2010-2012
Figure 17.11, Import&Export Volume of Vitamin B2 in China, 2009-2012
Figure 17.12, Origins of Imported Vitamin B2 in China and Their Share in 2012
Figure 17.13, Destinations of China’s Exported Vitamin B2 and Their Share in 2012
Figure 17.14, Changes of Import and Export Price of Vitamin B2 in China, 2009-2012
Figure 17.15, Importing Enterprises of Vitamin B2 in China and Their Share in 2012
Figure 17.16, Exporting Enterprises of Vitamin B2 in China and Their Share in 2012
Figure 17.17, Output of Vitamin B6 in China, 2009-2012
Figure 17.18, Monthly Price Changes of Vitamin B6 in China, 2010-2012
Figure 17.19, Import&Export Volume of Vitamin B6 in China, 2009-2012
Figure 17.20, Origins of Imported Vitamin B6 in China and Their Share in 2012
Figure 17.21, Destinations of China’s Exported Vitamin B6 and Their Share in 2012
Figure 17.22, Changes of Import&Export Price of Vitamin B6 in China, 2009-2012
Figure 17.23, Importing Enterprises of Vitamin B6 in China and Their Share in 2012
Figure 17.24, Exporting Enterprises of Vitamin B6 in China and Their Share in 2012
Figure 17.25, Output of Vitamin B12 in China, 2009-2012
Figure 17.26, Monthly Price Changes of Vitamin B12 in China, 2010-2012
Figure 17.27, Import&Export Volume of Vitamin B12 in China, 2009-2012
Figure 17.28, Origins of Imported Vitamin B12 in China and Their Share in 2012
Figure 17.29, Destinations of China’s Exported Vitamin B12 and Their Share in 2012
Figure 17.30, Changes of Import&Export Price of Vitamin B12 in China, 2009-2012
Figure 17.31, Importing Enterprises of Vitamin B12 in China and Their Share in 2012
Figure 17.32, Exporting Enterprises of Vitamin B12 in China and Their Share in 2012
Figure 17.33, Output of Vitamin C in China, 2009-2012
Figure 17.34, Monthly Price Changes of Vitamin C in China, 2010-2012
Figure 17.35, Import&Export Volume of Vitamin C in China, 2009-2012
Figure 17.36, Origins of Imported Vitamin C in China and Their Share in 2012
Figure 17.37, Destinations of China’s Exported Vitamin C and Their Share in 2012
Figure 17.38, Changes of Import&Export Price of Vitamin C in China, 2009-2012
Figure 17.39, Importing Enterprises of Vitamin C in China and Their Share in 2012
Figure 17.40, Exporting Enterprises of Vitamin C in China and Their Share in 2012
Figure 17.41, Output of Vitamin D3 in China, 2009-2012
Figure 17.42, Monthly Price Changes of Vitamin D3 in China, 2010-2012
Figure 17.43, Output of Vitamin E in China, 2009-2012
Figure 17.44, Monthly Price Changes of Vitamin E in China, 2010-2012
Figure 17.45, Import&Export Volume of Vitamin E in China, 2009-2012
Figure 17.46, Origins of Imported Vitamin E in China and Their Share in 2012
Figure 17.47, Destinations of China’s Exported Vitamin E and Their Share in 2012
Figure 17.48, Changes of Import&Export Price of Vitamin E in China, 2009-2012
Figure 17.49, Importing Enterprises of Vitamin E in China and Their Share in 2012
Figure 17.50, Exporting Enterprises of Vitamin E in China and Their Share in 2012
Figure 17.51, Output of Calcium Pantothenate in China, 2009-2012
Figure 17.52, Monthly Price Changes of Calcium Pantothenate in China, 2010-2012
Figure 17.53, Import&Export Volume of Calcium Pantothenate in China, 2009-2012
Figure 17.54, Origins of Imported Calcium Pantothenate in China and Their Share in 2012
Figure 17.55, Destinations of China’s Exported Calcium Pantothenate and Their Share in 2012
Figure 17.56, Changes of Import&Export Price of Calcium Pantothenate in China, 2009-2012
Figure 17.57, Importing Enterprises of Calcium Pantothenate in China and Their Share in 2012
Figure 17.58, Exporting Enterprises of Calcium Pantothenate in China and Their Share in 2012
Figure 17.59, Output of Choline Chloride in China, 2009-2012
Figure 17.60, Monthly Price Changes of Choline Chloride in China, 2010-2012
Figure 17.61, Import&Export Volume of Choline Chloride in China, 2009-2012
Figure 17.62, Origins of Imported Choline Chloride in China and Their Share in 2012
Figure 17.63, Destinations of China’s Exported Choline Chloride and Their Share in 2012
Figure 17.64, Changes of Import&Export Price of Choline Chloride in China, 2009-2012
Figure 17.65, Importing Enterprises of Choline Chloride in China and Their Share in 2012
Figure 17.66, Exporting Enterprises of Choline Chloride in China and Their Share in 2012
Attached Table1, Output of China’s Industrial Feed by Regions in 2012
Attached Table2, Output of China’s Complete feed by Types and by Regions in 2012
Attached Table3, Output of China’s Concentrated Feed by Types and by Regions in 2012
Attached Table4, Output of China’s Premix Feed by Types and by Regions in 2012
Attached Table5, China’s Feed Output by Types in 2012
Attached Table6, China’s Output of Complete feed by Regions(2007-2012)
Attached Table7, China’s Output of Complete feed for Hog by Regions(2007-2012)
Attached Table8, China’s Output of Complete feed for Egg-laying Poultry by Regions(2007-2012)
Attached Table9, China’s Output of Complete feed for Meat Poultry by Regions(2007-2012)
Attached Table10, China’s Output of Aquaculture Complete feed by Regions(2007-2012)
Attached Table11, China’s Output of Ruminant Complete feed by Regions(2007-2012)
Attached Table12, China’s Output of Complete feed for Other Animals by Region(2007-2012)
Attached Table13, China’s Output of Concentrated Feed by Regions(2007-2012)
Attached Table14, China’s Output of Addictive Premix Feed by Regions(2007-2012)
Attached Table15, Monthly Output of China’s Large-Scale Feed Enterprises 2007-2012
Attached Table16, Market Price of China’s Feed and Feed Ingredients in 2012
Attached Table17, Balance Sheet of China’s Corn Supply and Demand(2007-2012)
Attached Table18, Balance Sheet of China’s Soybean Meal Supply and Demand(2007-2012)
Attached Table19, China’s Output of Feed Fish Meal by Regions(2007-2012)
Attached Table20, Balance Sheet of China’s Fish Meal Supply and Demand(2007-2012)
Attached Table21, China’s Output of Meat & Bone Meal by Regions(2007-2012)
Attached Table22, Balance Sheet of China’s Meat & Bone Meal Supply and Demand(2007-2012)
Attached Table23, China’s Output of Lysine by Regions(2007-2012)
Attached Table24, Balance Sheet of China’s Lysine Supply and Demand(2007-2012)
Attached Table25, Balance Sheet of China’s Methionine Supply and Demand(2007-2012)
Note:
The names and order of the above figures and tables may be slightly different from the final version.
China’s live pig import & export mainly include the import & export of breeding swine and live pigs. China exports only a few breeding swine. In 2012, China only exported 1,308 breeding swine decreasing by 26.85% than the 1,788 breeding swine of 2011. Breeding swine were mainly exported to Hong Kong and Mongolia.
For the import of breeding swine, please see 3.2.1. As the import of live commercial pigs was only a few, this part focuses on the export of live commercial pigs in 2012.
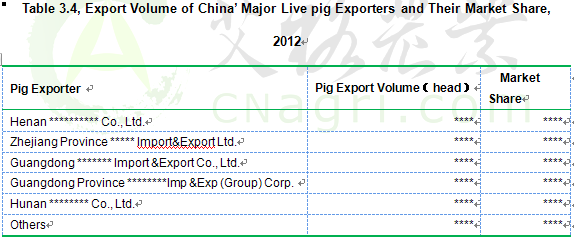
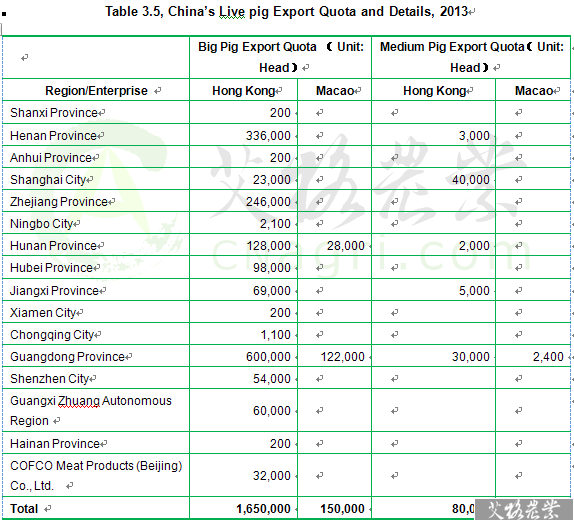
In 2012 China exported 1,620,000 live pigs weighing over 50 kg, mainly to Hong Kong(about 1,520,000 pigs) and Macao (98,700 pigs). The market shares of China’s major commercial pig exporters are listed in Table 3.4. China’s live pig export quota in 2013 is 1,882,400 pigs. The details are in Table 3.5.
Part One Overview of China’s Feed Market, 2012/2013
- External Environment of China’s Feed Industry
- China’s Micro-economy and Its Impact
- New Published Feed Laws and Regulations and Their Impact
1.2.2 “Measures for the Management of Production Licenses for Feeds and Feed Additives”
1.2.3 “Administrative Measures for Feed Additives and Feed Additives Premix Products Approval Number”
1.2.4 “Feed Production Enterprises Permission Conditions”
1.2.5 “Mixed Feed Addictives Production Enterprises Permission Conditions”
1.2.6 “Feedstuff Directory”
1.2.7 Interpretation of Other Policies Published in 2012
- Grain Output and Its Impact
- Livestock Inventory and Its Impact
- Global Feed Production Status in 2012
- Production and Consumption of China’s Industrial Feed in 2012
- Constitution of China’s Feed Enterprises in 2012
2.1.2 Product Types Constitution
2.1.3 Production Capacity Constitution of Complete feed Enterprises
- China’s Industrial Feed Supply in 2012
2.2.2Analysis of China’s Feed Output 2012
2.2.3Analysis of the Feed Output of China’s Large-scale Feed Enterprises in 2012
- Profit of Feed Processing by Types in China in 2012
- Changes of China’s Commercial Market Capacity in 2012 and the Outlook in 2013
- Analysis of Feed Output of China’s Top 10 Large-scale Feed Group in 2012
- China’s Industrial Feed Production and Consumption Outlook in 2013
Part Two Analysis of China’s Feed Market Segments, 2012/2013
- Review and Outlook of China’s Hog Feed Market, 2012/2013
- Analysis of Hog Feed Demand in China in 2012
- Market Share of Hog Feed in China in 2012
- Output and Consumption of Hog Feed in China in 2012
- Distribution of Hog Feed Production in China in 2012
- Hog Feed Market Concentration in China in 2012
- Investment and Market Share of Top 10 Hog Feed Enterprises in China in 2012
- Outlook of Hog Feed Production and Consumption in China in 2013
- Review and Outlook of China’s Meat Poultry Feed Market, 2012/2013
- Analysis of Meat Poultry Feed Demand in China in 2012
- Market Share of Meat Poultry Feed in China in 2012
- Output and Consumption of Meat Poultry Feed in China in 2012
- Distribution of Meat Poultry Feed Production in China in 2012
- Meat Poultry Feed Market Concentration in China in 2012
- Investment and Market Share of Top 10 Meat Poultry Feed Enterprises in China in 2012
- Outlook of Meat Poultry Feed Production and Consumption in China in 2013
- Review and Outlook of China’s Egg-laying Poultry Feed Market, 2012/2013
- Analysis of Egg-laying Poultry Feed Demand in China in 2012
- Market Share of Egg-laying Poultry Feed in China in 2012
- Output and Consumption of Egg-laying Poultry Feed in China in 2012
- Distribution of Egg-laying Poultry Feed Production in China in 2012
- Egg-laying Poultry Feed Market Concentration in China in 2012
- Investment and Market Share of Top 10 Egg-laying Poultry Feed Enterprises in China in 2012
- Outlook of Egg-laying Poultry Feed Production and Consumption in China in 2013
- Review and Outlook of China’s Aquiculture Feed Market, 2012/2013
- Analysis of Aquiculture Feed Demand in China in 2012
- Market Share of Aquiculture Feed in China in 2012
- Output and Consumption of Aquiculture Feed in China in 2012
- Distribution of Aquiculture Feed Production in China in 2012
- Aquiculture Feed Market Concentration in China in 2012
- Investment and Market Share of Top 10 Aquiculture Feed Enterprises in China in 2012
- Outlook of Aquiculture Feed Production and Consumption in China in 2013
- Review and Outlook of China’s Ruminant Feed Market, 2012/2013
- Analysis of Ruminant Feed Demand in China in 2012
- Market Share of Ruminant Feed in China in 2012
- Output and Consumption of Ruminant Feed in China in 2012
- Distribution of Ruminant Feed Production in China in 2012
- Ruminant Feed Market Concentration in China in 2012
- Investment and Market Share of Top 10 Ruminant Feed Enterprises in China in 2012
- Outlook of Ruminant Feed Production and Consumption in China in 2013
Part Three Analysis of China’s Main Bulk Feed Ingredients Market, 2012/2013
- Analysis of Overall Consumption of China’s Main Bulk Feed Ingredients in 2012
- Consumption of Complete feed Ingredients
- Consumption of Self-Mixed Feed Ingredients
- Consumption of Concentrated Feed Ingredients
- Consumption of Premix Ingredients
- Analysis of Hog Feed Ingredients Consumption
- Analysis of Meat Poultry Feed Ingredients Consumption
- Analysis of Egg-laying Poultry Feed Ingredients Consumption
- Analysis of Aquaculture Feed Ingredients Consumption
- Outlook of China’s Feed Ingredients in 2013
- Analysis of China’s Feed Corn Market in 2012
- Overview of Global Corn Market
- Analysis of China’s Corn Supply
- Planting Area
- Per Unit Area Yield and Output
- Analysis of China’s Corn Price Trend in 2012
- Analysis of China’s Corn Import and Future Trend
- Analysis of China’s Major Corn Import&Export Enterprises in 2012
- Analysis of China’s Corn Export and Future Trend
- Food Consumption of Corn and Industrial Consumption of Corn in China
- China’s Feed Consumption of Corn
- Consumption of Corn in Complete feed and in Self-Mixed Feed
- Consumption of Corn in Feed for Livestock, Poultry and Aquaculture
- Consumption of Wheat as an Alternative of Feed Corn in 2012
- Changes of China’s Ending Inventory of Corn
- Outlook of China’s Feed Corn Consumption in 2013
- Analysis of China’s Soybean Meal Market in 2012
- Overview of Global Soybean Market
- Analysis of China’s Soybean Supply
- Analysis of Domestic Soybean Supply
- Analysis of Imported Soybean Supply
- Analysis of Soybean Meal Price Trend in China in 2012
- Analysis of Soybean Meal Import & Export in China in 2012
- Analysis of China’s Major Soybean Meal Import & Export Enterprises in 2012
- Analysis of China’s Soybean Meal Consumption in 2012
- Consumption of Soybean Meal in Complete feed, Concentrated Feed and Self-mixed Feed
- Consumption of Soybean Meal in Feed for Livestock, Poultry and Aquaculture
- Outlook of China’s Soybean Meal Market in 2013
- Analysis of China’s Feed Fish Meal Market in 2012
- Overview of Global Feed Fish Meal Market
- Analysis of China’s Feed Fish Meal Supply
- Major Production Areas
- Analysis of Domestic Feed Fish Meal Supply
- Analysis of Imported Feed Fish Meal Supply
- Analysis of China’s Feed Fish Meal Price Trend in 2012
- Profit Analysis of China’s Feed Fish Meal Manufacturing Enterprises in 2012
- Analysis of China’s Major Feed Fish Meal Import & Export Enterprises in 2012
- Analysis of China’s Feed Fish Meal Consumption in 2012
- Consumption of Feed Fish Meal in Complete feed, Concentrated Feed and Self-mixed Feed
- Consumption of Feed Fish Meal in Feed for Livestock, Poultry and Aquaculture
- Outlook of China’s Feed Fish Meal Market in 2013
- Analysis of China’s Meat &Bone Meal Market in 2012
- Overview of Global Meat & Bone Meal Market
- Analysis of China’s Meat & Bone Meal Supply
- Analysis of Domestic Meat & Bone Meal Supply
- Analysis of Imported Meat & Bone Supply
- Analysis of China’s Major Meat & Bone Import & Export Enterprises in 2012
- Consumption Structure of China’s Meat & Bone in 2012
- Consumption of Meat & Bone in Complete feed, Concentrated Feed and Self-mixed Feed
- Consumption of Meat &Bone in Feed for Livestock and Poultry
- Outlook of China’s Meat & Bone Market in 2013
- Analysis of Other Major Bulk Feed Ingredients Market
- DDGS
- DDGS Supply in China in 2012
- Analysis of DDGS Price Trend in China in 2012
- Analysis of DDGS Import&Export in China in 2012
- Analysis of DDGS Consumption in China in 2012
- Rapeseed Meal
- Rapeseed Meal Supply in China in 2012
- Analysis of Rapeseed Meal Price Trend in China in 2012
- Analysis of Rapeseed Meal Import&Export in China in 2012
- Analysis of Rapeseed Meal Consumption in China in 2012
- Cottonseed Meal
- Cottonseed Meal Supply in China in 2012
- Analysis of Cottonseed Meal Price Trend in China in 2012
- Analysis of Cottonseed Meal Import&Export in China in 2012
- Analysis of Cottonseed Meal Consumption in China in 2012
- Price Trend and Import&Export of Other Feed Ingredients
- DDGS
Part Four Analysis of China’s Main Feed Addictives Market, 2012/2013
- Analysis of China’s Feed Lysine Market in 2012
- Overview of Global Feed Lysine Market
- Analysis of China’s Feed Lysine Supply
- Major Production Areas
- Major Manufacturing Enterprises
- Analysis of 98.5% Lysine Supply
- Analysis of 65% Lysine Supply
- Analysis of Imported Lysine Supply
- Analysis of China’s Lysine Price Trend in 2012
- Analysis of China’s Major Lysine Import & Export Enterprises in 2012
- Analysis of China’s Lysine Consumption in 2012
- Consumption of 98.5% Lysine and 65% Lysine
- Domestic Consumption and Exportation
- Investment of China’s Lysine Industry in 2012
- Outlook of China’s Feed Lysine Market in 2013
- Analysis of China’s Feed Methionine Market in 2012
- Overview of Global Feed Methionine Market
- Analysis of China’s Feed Methionine Supply
- Analysis of Domestic Methionine Supply
- Analysis of Imported Methionine Supply
- Analysis of China’s Methionine Price Trend in 2012
- Analysis of China’s Major Methionine Import & Export Enterprises in 2012
- Analysis of China’s Methionine Consumption 2012
- Investment of China’s Methionine Industry in 2012
- Outlook of China’s Feed Methionine Market in 2013
- Analysis of China’s Feed Threonine Market in 2012
- Overview of Global Feed Threonine Market
- Analysis of Feed Threonine Supply in China
- Major Production Areas
- Major Manufacturing Enterprises
- Supply Quantity
- Analysis of China’s Threonine Price Trend in 2012
- Analysis of China’s Threonine Consumption in 2012
16.4.2 Consumption by Export
- Investment of China’s Threonine Industry in 2012
- Outlook of China’s Feed Threonine Market in 2013
- Analysis of China’s Feed Vitamin Market in 2012
- Analysis of Vitamin A Market
- Supply
- Market Price
- Import&Export Analysis
- Variation of Import Volume and Export Volume
- Analysis of Importers and Exporters
- Analysis of Import Price and Export Price
- Analysis of Import&Export Enterprises
- Analysis of Vitamin B1 Market
- Supply
- Market Price
- Import&Export Analysis
- Variation of Import Volume and Export Volume
- Analysis of Importers and Exporters
- Analysis of Import Price and Export Price
- Analysis of Import&Export Enterprises
- Analysis of Vitamin B2 Market
- Supply
- Market Price
- Import&Export Analysis
- Variation of Import Volume and Export Volume
- Analysis of Importers and Exporters
- Analysis of Import Price and Export Price
- Analysis of Import&Export Enterprises
- Analysis of Vitamin B6 Market
- Supply
- Market Price
- Import&Export Analysis
- Variation of Import Volume and Export Volume
- Analysis of Importers and Exporters
- Analysis of Import Price and Export Price
- Analysis of Import&Export Enterprises
- Analysis of Vitamin B12 Market
- Supply
- Market Price
- Import&Export Analysis
- Variation of Import Volume and Export Volume
- Analysis of Importers and Exporters
- Analysis of Import Price and Export Price
- Analysis of Import&Export Enterprises
- Analysis of Vitamin C Market
- Supply
- Market Price
- Import&Export Analysis
- Variation of Import Volume and Export Volume
- Analysis of Importers and Exporters
- Analysis of Import Price and Export Price
- Analysis of Import&Export Enterprises
- Analysis of Vitamin D3 Market
- Supply
- Market Price
- Analysis of Vitamin E Market
- Supply
- Market Price
- Import&Export Analysis
- Variation of Import Volume and Export Volume
- Analysis of Importers and Exporters
- Analysis of Import Price and Export Price
- Analysis of Import&Export Enterprises
- Analysis of Calcium Pantothenate Market
- Supply
- Market Price
- Import&Export Analysis
- Variation of Import Volume and Export Volume
- Analysis of Importers and Exporters
- Analysis of Import Price and Export Price
- Analysis of Import&Export Enterprises
- Analysis of Choline Chloride Market
- Supply
- Market Price
- Import&Export Analysis
- Variation of Import Volume and Export Volume
- Analysis of Importers and Exporters
- Analysis of Import Price and Export Price
- Analysis of Import&Export Enterprises
- Analysis of Other Vitamins Market in 2012
- Analysis of Vitamin A Market
List of Part Tables and Figures
Table 1.1, Comparison of China’s Main Breeding Animals Inventory between 2011 and 2012
Figure 1.1, Global Industrial Feed Output and Forecast, 2007-2013
Figure 2.1, Structure of China’s Feed Enterprises in 2012 (by product types)
Figure 2.2, Number Variation of Complete feed Enterprises in China, 2007-2012
Figure 2.3, Output, Capacity and Capacity Utilization Rate of China’s Feed, 2007-2012
Figure 2.4, China’s Feed Output, 2007-2012
Figure 2.5, Output of China’s Scaled Feed Enterprises, 2007-2012
Figure 2.6, Retail Prices of China’s Complete feed for Fattening Pigs, Broiler and Layers, 2007-2012
Figure 2.7, Processing Profit of Feed for Hog, Broiler and Layers, 2007-2012
Figure 2.8, Variation of China’s Commercial Feed Market Capacity, 2007-2012
Figure 2.9, Weight of Top 10 Feed Enterprises’ Output in National Feed Output, 2007-2012
Figure 2.10, Top 10 Feed Enterprises and Their Market Share in 2012
Figure 3.1, Market Share of Hog Feed in China in 2012
Figure 3.2, Market Share Variation Trend of Hog Feed in China, 2007-2012
Figure 3.3, Variation Trend of China’s Hog Feed Output, 2007-2012
Figure 3.4, Variation Trend of China’s Hog Complete feed Output, 2007-2012
Figure 3.5, Variation Trend of China’s Hog Concentrated Feed Output, 2007-2012
Figure 3.6, Variation Trend of China’s Hog Premix Output, 2007-2012
Figure 3.7, Regional Structure of Hog Feed in China in 2012
Figure 3.8, Variation Trend of China’s Hog Feed Market Concentration, 2007-2012
Figure 3.9, Top 10 Hog Feed Enterprises and Their Market Share in 2012
Figure 4.1, Market Share Variation Trend of Meat Poultry Feed in China, 2007-2012
Figure 4.2, Variation Trend of China’s Meat Poultry Feed Output, 2007-2012
Figure 4.3, Variation Trend of China’s Meat Poultry Complete feed Output, 2007-2012
Figure 4.4, Variation Trend of China’s Meat Poultry Concentrated Feed Output, 2007-2012
Figure 4.5 Variation Trend of China’s Meat Poultry Premix Output, 2007-2012
Figure 4.6, Regional Structure of Meat Poultry Feed in China in 2012
Figure 4.7, Variation Trend of China’s Meat Poultry Feed Market Concentration, 2007-2012
Figure 4.8, Top 10 Meat Poultry Feed Enterprises and Their Market Share in 2012
Figure 5.1, Market Share Variation Trend of Egg-laying Poultry Feed in China, 2007-2012
Figure 5.2, Variation Trend of China’s Egg-laying Poultry Feed Output, 2007-2012
Figure 5.3, Variation Trend of China’s Egg-laying Poultry Complete feed Output, 2007-2012
Figure 5.4, Variation Trend of China’s Egg-laying Poultry Concentrated Feed Output, 2007-2012
Figure 5.5 Variation Trend of China’s Egg-laying Poultry Premix Output, 2007-2012
Figure 5.6, Regional Structure of Egg-laying Poultry Feed in China in 2012
Figure 5.7, Variation Trend of China’s Egg-laying Poultry Feed Market Concentration, 2007-2012
Figure 5.8, Top 10 Egg-laying Poultry Feed Enterprises and Their Market Share in 2012
Figure 6.1, Market Share Variation Trend of Aquiculture Feed in China, 2007-2012
Figure 6.2, Variation Trend of China’s Aquiculture Feed Output, 2007-2012
Figure 6.3, Variation Trend of China’s Aquiculture Complete feed Output, 2007-2012
Figure 6.4, Variation Trend of China’s Aquiculture Concentrated Feed Output, 2007-2012
Figure 6.5 Variation Trend of China’s Aquiculture Premix Output, 2007-2012
Figure 6.6, Regional Structure of Aquiculture Feed in China in 2012
Figure 6.7, Variation Trend of China’s Aquiculture Feed Market Concentration, 2007-2012
Figure 6.8, Top 10 Aquiculture Feed Enterprises and Their Market Share in 2012
Figure 7.1, Market Share Variation Trend of Ruminant Feed in China, 2007-2012
Figure 7.2, Variation Trend of China’s Ruminant Feed Output, 2007-2012
Figure 7.3, Variation Trend of China’s Ruminant Complete feed Output, 2007-2012
Figure 7.4, Variation Trend of China’s Ruminant Concentrated Feed Output, 2007-2012
Figure 7.5 Variation Trend of China’s Ruminant Premix Output, 2007-2012
Figure 7.6, Regional Structure of Ruminant Feed in China in 2012
Figure 7.7, Variation Trend of China’s Ruminant Feed Market Concentration, 2007-2012
Figure 7.8, Top 10 Ruminant Feed Enterprises and Their Market Share in 2012
Figure 8.1, Total Consumption of Main Bulk Feed Ingredients in China, 2009-2012
Figure 8.2, Total Consumption Structure of Main Bulk Feed Ingredients in China in 2012
Figure 8.3, Consumption of Main Bulk Feed Ingredients of Complete feed in China, 2009-2012
Figure 8.4, Consumption Structure of Main Bulk Feed Ingredients of Complete feed in China in 2012
Figure 8.5, Consumption of Main Bulk Feed Ingredients of Self-mixed Concentrated Feed in China, 2009-2012
Figure 8.6, Consumption Structure of Main Bulk Feed Ingredients of Self-mixed Concentrated Feed in China in 2012
Figure 8.7, Consumption of Main Bulk Feed Ingredients of Self-mixed Premix in China, 2009-2012
Figure 8.8, Consumption Structure of Main Bulk Feed Ingredients of Self-mixed Premix in China in 2012
Figure 8.9, Consumption Structure of Main Bulk Feed Ingredients of Hog Feed in China in 2012
Figure 8.10, Consumption Structure of Main Bulk Feed Ingredients of Meat Poultry Feed in China in 2012
Figure 8.11, Consumption Structure of Main Bulk Feed Ingredients of Egg-laying Poultry Feed in China in 2012
Figure 8.12, Consumption Structure of Main Bulk Feed Ingredients of Aquaculture Feed in China in 2012
Figure 9.1, Planting Area of Corn in China, 2007-2012
Figure 9.2, Corn Output in China, 2007-2012
Figure 9.3, Per Unit Area Yield of Corn in China, 2007-2012
Figure 9.4, Annual Average Price of Corn in China, 2007-2012
Figure 9.5, Changes of Corn Price in China in 2012
Figure 9.6, Import Volume and Export Volume of Corn in China, 2007-2012 (calendar year)
Figure 9.7, Import Volume and Export Volume of Corn in China, 2007-2012 (crop year)
Figure 9.8, Origins of China’s Imported Corn and Their Share in 2012
Figure 9.10, Corn Import Volume of Major Corn Importing Enterprises in China in 2012
Figure 9.11, Corn Export Volume of Major Corn Exporting Enterprises in China in 2012
Figure 9.12, Price and Export Volume of Corn in China 2007/2008-2012/2013
Figure 9.13, Corn Consumption Structure in China in 2012
Figure 9.14, Industrial Consumption Structure of Corn in China in 2012
Figure 9.15, Industrial Consumption and Price of Corn in China, 2007-2012
Figure 9.16, Corn Price and Feed Consumption in China, 2007-2012
Figure 9.17, Consumption of Corn in Complete feed and Self-mixed Feed in China, 2009-2012
Figure 9.18, Consumption of Corn in Various Animal Feed in China, 2009-2012
Figure 9.19, Wheat and By-product Consumption in Feed, 2009-2012
Figure 9.20, Changes of Corn Inventory in China, 2007/2008-2012/2013
Figure 10.1, Output of Domestic Soybean and Import Volume of Soybean in China, 2007-2012
Figure 10.2, Origins of China’s Imported Soybean and Their Share in 2012
Figure 10.3, Annual Average Price of Soybean Meal in China, 2007-2012
Figure10.4, Changes of Soybean Meal Price in China in 2012
Figure 10.5 Import & Export Volume of Soybean Meal in China, 2007-2012
Figure 10.6, Origins of China’s Imported Soybean Meal and Their Share in 2012
Figure 10.7, Destinations of China’s Exported Soybean Meal and Their Share in 2012
Figure 10.8, Soybean Meal Import Volume of Major Soybean Meal Importing Enterprises in China in 2012
Figure 10.9, Soybean Meal Export Volume of Major Soybean Meal Exporting Enterprises in China in 2012
Figure 10.10, Consumption of Soybean Meal in Feed in China, 2007-2012
Figure 10.11, Consumption of Soybean Meal in Complete feed and Self-mixed Feed in China, 2009-2012
Figure 10.12, Consumption of Soybean Meal in Various Animal Feed in China, 2009-2012
Figure 11.1, Global Fish Meal Output, 2007-2012
Figure 11.2, Regional Structure of Fish Meal Production in China in 2012
Figure 11.3, Output of Fish Meal in China, 2007-2012
Figure 11.4, Output and Import Volume of Fish Meal in China, 2007-2012
Figure 11.5, Origins of China’s Imported Fish Meal and Their Share in 2012
Figure 11.6, Destinations of China’s Exported Fish Meal and Their Share in 2012
Figure 11.7, Annual Price of Imported Fish Meal in China, 2007-2012
Figure 11.8, Monthly Price Trend of Imported Fish Meal in China, 2009-2012
Figure 11.9, Price Trend of Fish Meal in China in 2012
Figure 11.10, Fish Meal Import Volume of Major Fish Meal Importing Enterprises in China in 2012
Figure 11.11, Fish Meal Export Volume of Major Fish Meal Exporting Enterprises in China in 2012
Figure 11.12, Consumption and Price of Fish Meal in China, 2007-2012
Figure 11.13, Consumption of Fish Meal in Complete feed and Self-mixed Feed in China, 2009-2012
Figure 11.14, Consumption of Fish Meal in Various Animal Feed in China, 2009-2012
Figure 12.1 Output and Import Volume of Meat&Bone Meal in China, 2007-2012
Figure 12.2, Regional Structure of Meat&Bone Meal Production in China in 2012
Figure 12.3, Origins of China’s Imported Meat and Bone Meal and Their Share in 2012
Figure 12.4, Import Volume of Meat and Bone Meal of Major Meat and Bone Meal Importing Enterprises in China in 2012
Figure 12.5, Consumption of Meat and Bone Meal in China, 2009-2012
Figure 12.6, Consumption of Meat and Bone Meal in Complete feed and Self-mixed Feed in China, 2009-2012
Figure 12.7, Consumption of Meat and Bone Meal in Various Animal Feed in China, 2009-2012
Figure 13.1, Output of DDGS in China, 2007-2012
Figure 13.2, Price Trend of DDGS in China in 2012
Figure 13.3, Import&Export Volume of DDGS in China, 2007-2012
Figure 13.4, Origins of China’s Imported DDGS and Their Share in 2012
Figure 13.5, Destinations of China’s Exported DDGS and Their Share in 2012
Figure 13.6, Import Price and Export Price Trend of DDGS in China, 2009-2012
Figure 13.7, Consumption of DDGS in Various Animal Feed in China in 2012
Figure 13.8, Output of Rapeseed Meal in China, 2007-2012
Figure 13.9, Price Trend of Rapeseed Meal in China in 2012
Figure 13.10, Monthly Import&Export Volume of Rapeseed Meal in China, 2009-2012
Figure 13.11, Origins of Imported Rapeseed Meal in China and Their Share in 2012
Figure 13.12, Destinations of China’s Exported Rapeseed Meal and Their Share in 2012
Figure 13.13, Import Price and Export Price Trend of Rapeseed Meal in China, 2009-2012
Figure 13.14, Import Volume of Major Rapeseed Meal Importing Enterprises in China in 2012
Figure 13.15, Export Volume of Major Rapeseed Meal Exporting Enterprises in China in 2012
Figure 13.16, Consumption of Rapeseed Meal in Various Animal Feed in China in 2012
Figure 13.17, Output of Cottonseed Meal in China, 2007-2012
Figure 13.18, Price Trend of Cottonseed Meal in China in 2012
Figure 13.19, Import&Export Volume of Cottonseed Meal in China, 2007-2012
Figure 13.20, Origins of Imported Cottonseed Meal in China and Their Share in 2012
Figure 13.21, Destinations of China’s Exported Cottonseed Meal and Their Share in 2012
Figure 13.22, Import Price and Export Price Trend of Cottonseed Meal in China, 2009-2012
Figure 13.23, Consumption of Rapeseed Meal in Various Animal Feed in China in 2012
Figure 14.1, Output of Lysine in China, 2007-2012
Figure 14.2, Regional Structure of Lysine Production in China in 2012
Figure 14.3, Capacity Structure of China’s Lysine Manufacturing Enterprises in 2012
Figure 14.4, Output of 98.5% Lysine and 65% Lysine in China, 2007-2012
Figure 14.5, Import&Export Volume of Lysine in China, 2007-2012
Figure 14.6, Origins of Imported 65% Lysine in China and Their Share in 2012
Figure 14.7, Annual Price of Lysine in China, 2007-2012
Figure 14.8, Price Trend of 98.5% Lysine and 65% Lysine in China in 2012
Figure 14.9, Import Volume of Major 65% Lysine Importing Enterprises in China in 2012
Figure14.10, Consumption of 98.5% Lysine and 65% Lysine in China, 2007-2012
Figure 14.11, Domestic Consumption and Exportation of Lysine in China, 2007-2012
Figure 14.12, Exporting Countries of 65% Lysine in China and Their Share in 2012
Figure 14.13, Export Volume of Major 98.5% Lysine Exporting Enterprises in China in 2012
Figure 14.14, Export Volume of Major 65% Lysine Exporting Enterprises in China in 2012
Figure 15.1, Import Volume of Methionine in China, 2007-2012
Figure 15.2, Origins of Imported Methionine in China and Their Share in 2012
Figure 15.3, Annual Price of Methionine in China, 2007-2012
Figure 15.4, Import Volume of Major Methionine Importing Enterprises in China in 2012
Figure 15.5, Consumption of Methionine in China, 2007-2012
Figure 16.1, Regional Structure of Threonine Production in China in 2012
Figure 16.2, Enterprises Structure of Threonine Production in China in 2012
Figure 16.3, Output of Threonine in China, 2007-2012
Figure 16.4, Annual Price of Threonine in China, 2007-2012
Figure 16.5, Consumption of Threonine in China, 2008-2012
Figure 16.6, Import&Export Volume of Threonine and other Amino-acid in China, 2007-2012
Figure 17.1, Output of Vitamin A in China, 2009-2012
Figure 17.2, Monthly Price Changes of Vitamin A in China, 2010-2012
Figure 17.3, Import&Export Volume of Vitamin A in China, 2009-2012
Figure 17.4, Origins of Imported Vitamin A in China and Their Share in 2012
Figure 17.5, Destinations of China’s Exported Vitamin A and Their Share in 2012
Figure 17.6, Changes of Import&Export Price of Vitamin A in China, 2009-2012
Figure 17.7, Importing Enterprises of Vitamin A in China and Their Share in 2012
Figure 17.8, Exporting Enterprises of Vitamin A in China and Their Share in 2012
Figure 17.9, Output of Vitamin B2 in China, 2009-2012
Figure 17.10, Monthly Price Changes of Vitamin B2 in China, 2010-2012
Figure 17.11, Import&Export Volume of Vitamin B2 in China, 2009-2012
Figure 17.12, Origins of Imported Vitamin B2 in China and Their Share in 2012
Figure 17.13, Destinations of China’s Exported Vitamin B2 and Their Share in 2012
Figure 17.14, Changes of Import and Export Price of Vitamin B2 in China, 2009-2012
Figure 17.15, Importing Enterprises of Vitamin B2 in China and Their Share in 2012
Figure 17.16, Exporting Enterprises of Vitamin B2 in China and Their Share in 2012
Figure 17.17, Output of Vitamin B6 in China, 2009-2012
Figure 17.18, Monthly Price Changes of Vitamin B6 in China, 2010-2012
Figure 17.19, Import&Export Volume of Vitamin B6 in China, 2009-2012
Figure 17.20, Origins of Imported Vitamin B6 in China and Their Share in 2012
Figure 17.21, Destinations of China’s Exported Vitamin B6 and Their Share in 2012
Figure 17.22, Changes of Import&Export Price of Vitamin B6 in China, 2009-2012
Figure 17.23, Importing Enterprises of Vitamin B6 in China and Their Share in 2012
Figure 17.24, Exporting Enterprises of Vitamin B6 in China and Their Share in 2012
Figure 17.25, Output of Vitamin B12 in China, 2009-2012
Figure 17.26, Monthly Price Changes of Vitamin B12 in China, 2010-2012
Figure 17.27, Import&Export Volume of Vitamin B12 in China, 2009-2012
Figure 17.28, Origins of Imported Vitamin B12 in China and Their Share in 2012
Figure 17.29, Destinations of China’s Exported Vitamin B12 and Their Share in 2012
Figure 17.30, Changes of Import&Export Price of Vitamin B12 in China, 2009-2012
Figure 17.31, Importing Enterprises of Vitamin B12 in China and Their Share in 2012
Figure 17.32, Exporting Enterprises of Vitamin B12 in China and Their Share in 2012
Figure 17.33, Output of Vitamin C in China, 2009-2012
Figure 17.34, Monthly Price Changes of Vitamin C in China, 2010-2012
Figure 17.35, Import&Export Volume of Vitamin C in China, 2009-2012
Figure 17.36, Origins of Imported Vitamin C in China and Their Share in 2012
Figure 17.37, Destinations of China’s Exported Vitamin C and Their Share in 2012
Figure 17.38, Changes of Import&Export Price of Vitamin C in China, 2009-2012
Figure 17.39, Importing Enterprises of Vitamin C in China and Their Share in 2012
Figure 17.40, Exporting Enterprises of Vitamin C in China and Their Share in 2012
Figure 17.41, Output of Vitamin D3 in China, 2009-2012
Figure 17.42, Monthly Price Changes of Vitamin D3 in China, 2010-2012
Figure 17.43, Output of Vitamin E in China, 2009-2012
Figure 17.44, Monthly Price Changes of Vitamin E in China, 2010-2012
Figure 17.45, Import&Export Volume of Vitamin E in China, 2009-2012
Figure 17.46, Origins of Imported Vitamin E in China and Their Share in 2012
Figure 17.47, Destinations of China’s Exported Vitamin E and Their Share in 2012
Figure 17.48, Changes of Import&Export Price of Vitamin E in China, 2009-2012
Figure 17.49, Importing Enterprises of Vitamin E in China and Their Share in 2012
Figure 17.50, Exporting Enterprises of Vitamin E in China and Their Share in 2012
Figure 17.51, Output of Calcium Pantothenate in China, 2009-2012
Figure 17.52, Monthly Price Changes of Calcium Pantothenate in China, 2010-2012
Figure 17.53, Import&Export Volume of Calcium Pantothenate in China, 2009-2012
Figure 17.54, Origins of Imported Calcium Pantothenate in China and Their Share in 2012
Figure 17.55, Destinations of China’s Exported Calcium Pantothenate and Their Share in 2012
Figure 17.56, Changes of Import&Export Price of Calcium Pantothenate in China, 2009-2012
Figure 17.57, Importing Enterprises of Calcium Pantothenate in China and Their Share in 2012
Figure 17.58, Exporting Enterprises of Calcium Pantothenate in China and Their Share in 2012
Figure 17.59, Output of Choline Chloride in China, 2009-2012
Figure 17.60, Monthly Price Changes of Choline Chloride in China, 2010-2012
Figure 17.61, Import&Export Volume of Choline Chloride in China, 2009-2012
Figure 17.62, Origins of Imported Choline Chloride in China and Their Share in 2012
Figure 17.63, Destinations of China’s Exported Choline Chloride and Their Share in 2012
Figure 17.64, Changes of Import&Export Price of Choline Chloride in China, 2009-2012
Figure 17.65, Importing Enterprises of Choline Chloride in China and Their Share in 2012
Figure 17.66, Exporting Enterprises of Choline Chloride in China and Their Share in 2012
Attached Table1, Output of China’s Industrial Feed by Regions in 2012
Attached Table2, Output of China’s Complete feed by Types and by Regions in 2012
Attached Table3, Output of China’s Concentrated Feed by Types and by Regions in 2012
Attached Table4, Output of China’s Premix Feed by Types and by Regions in 2012
Attached Table5, China’s Feed Output by Types in 2012
Attached Table6, China’s Output of Complete feed by Regions(2007-2012)
Attached Table7, China’s Output of Complete feed for Hog by Regions(2007-2012)
Attached Table8, China’s Output of Complete feed for Egg-laying Poultry by Regions(2007-2012)
Attached Table9, China’s Output of Complete feed for Meat Poultry by Regions(2007-2012)
Attached Table10, China’s Output of Aquaculture Complete feed by Regions(2007-2012)
Attached Table11, China’s Output of Ruminant Complete feed by Regions(2007-2012)
Attached Table12, China’s Output of Complete feed for Other Animals by Region(2007-2012)
Attached Table13, China’s Output of Concentrated Feed by Regions(2007-2012)
Attached Table14, China’s Output of Addictive Premix Feed by Regions(2007-2012)
Attached Table15, Monthly Output of China’s Large-Scale Feed Enterprises 2007-2012
Attached Table16, Market Price of China’s Feed and Feed Ingredients in 2012
Attached Table17, Balance Sheet of China’s Corn Supply and Demand(2007-2012)
Attached Table18, Balance Sheet of China’s Soybean Meal Supply and Demand(2007-2012)
Attached Table19, China’s Output of Feed Fish Meal by Regions(2007-2012)
Attached Table20, Balance Sheet of China’s Fish Meal Supply and Demand(2007-2012)
Attached Table21, China’s Output of Meat & Bone Meal by Regions(2007-2012)
Attached Table22, Balance Sheet of China’s Meat & Bone Meal Supply and Demand(2007-2012)
Attached Table23, China’s Output of Lysine by Regions(2007-2012)
Attached Table24, Balance Sheet of China’s Lysine Supply and Demand(2007-2012)
Attached Table25, Balance Sheet of China’s Methionine Supply and Demand(2007-2012)
Note:
The names and order of the above figures and tables may be slightly different from the final version.
3.6 China’s Pork Trade in 2012
3.6.1 China’s Live pig Import & ExportChina’s live pig import & export mainly include the import & export of breeding swine and live pigs. China exports only a few breeding swine. In 2012, China only exported 1,308 breeding swine decreasing by 26.85% than the 1,788 breeding swine of 2011. Breeding swine were mainly exported to Hong Kong and Mongolia.
For the import of breeding swine, please see 3.2.1. As the import of live commercial pigs was only a few, this part focuses on the export of live commercial pigs in 2012.
In 2012 China exported 1,620,000 live pigs weighing over 50 kg, mainly to Hong Kong(about 1,520,000 pigs) and Macao (98,700 pigs). The market shares of China’s major commercial pig exporters are listed in Table 3.4. China’s live pig export quota in 2013 is 1,882,400 pigs. The details are in Table 3.5.
3.6.2 Import & Export of Fresh, Chilled and Frozen Pork
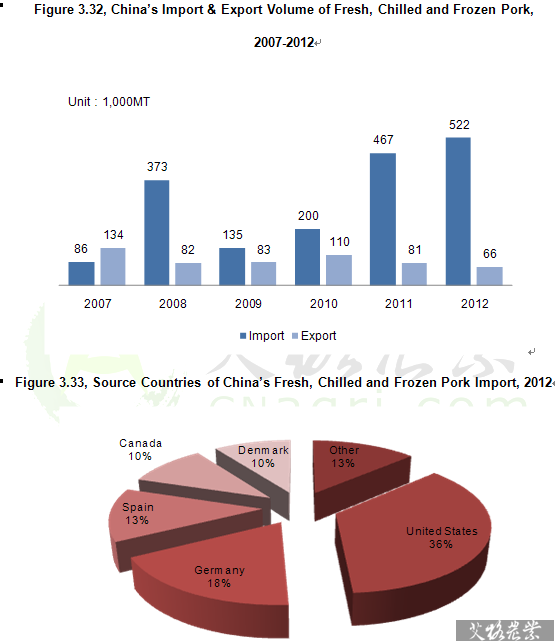
Despite the low pork price in 2012 in China, China’s pork import still reached a new historical record. In 2012, China imported 522,300 tons of fresh, chilled and frozen pork, increasing by 11.78% YOY, mainly from America, Germany, Spain, Canada and Denmark. For other products, see Table 3.6Most Popular »
- Top 10 Chinese Log Importers & Share Accounted for 44.5% in 2016
- Bunge (Dongguan)’s Oilseed Processing & Refining Projects Will Soon Be Put into Production
- KWS, Rosetta Green announce sugar beet agreement
- The world's largest Perfume manufacturer set up the factory in Guangzhou
- Along with the Changing Relation Between Supply and Demand, Turnover Rate of Temporarily-Stored Corn Auction Dropped Gre
- BOABC insight on China's soft drink industry (March, 2012 Issue)
- Dinotefuran received emergency exemption registration in Pennsylvania
- Amount of Phosphorite Mining in Yichang of Hubei in 2018 is Controlled in 10 Million MT
- Over-irrigation can cause walnut tree damage during drought

Featured »
- Pig prices in September
- BOABC Viewpoint
- The Loss of Corn Starch P...
- Corn Starch Prices in the...
- September Corn Prices in t...
- The profit of feeding sanh...
- The profit of raising whit...
- In September the price of...
- BOABC Viewpoint: Due to th...
- Market News in September
- Dairy Production Stood at...
- Hebei Further Heightens Raw Milk Reference Price
- Raw Milk Price Sustained U...
- Raw Milk Production Index ...